

Table To Chart
A web-based statistical chart generator to create watermark-free charts from tabular data without login or installation.
 Open product
What it does
About Table To Chart
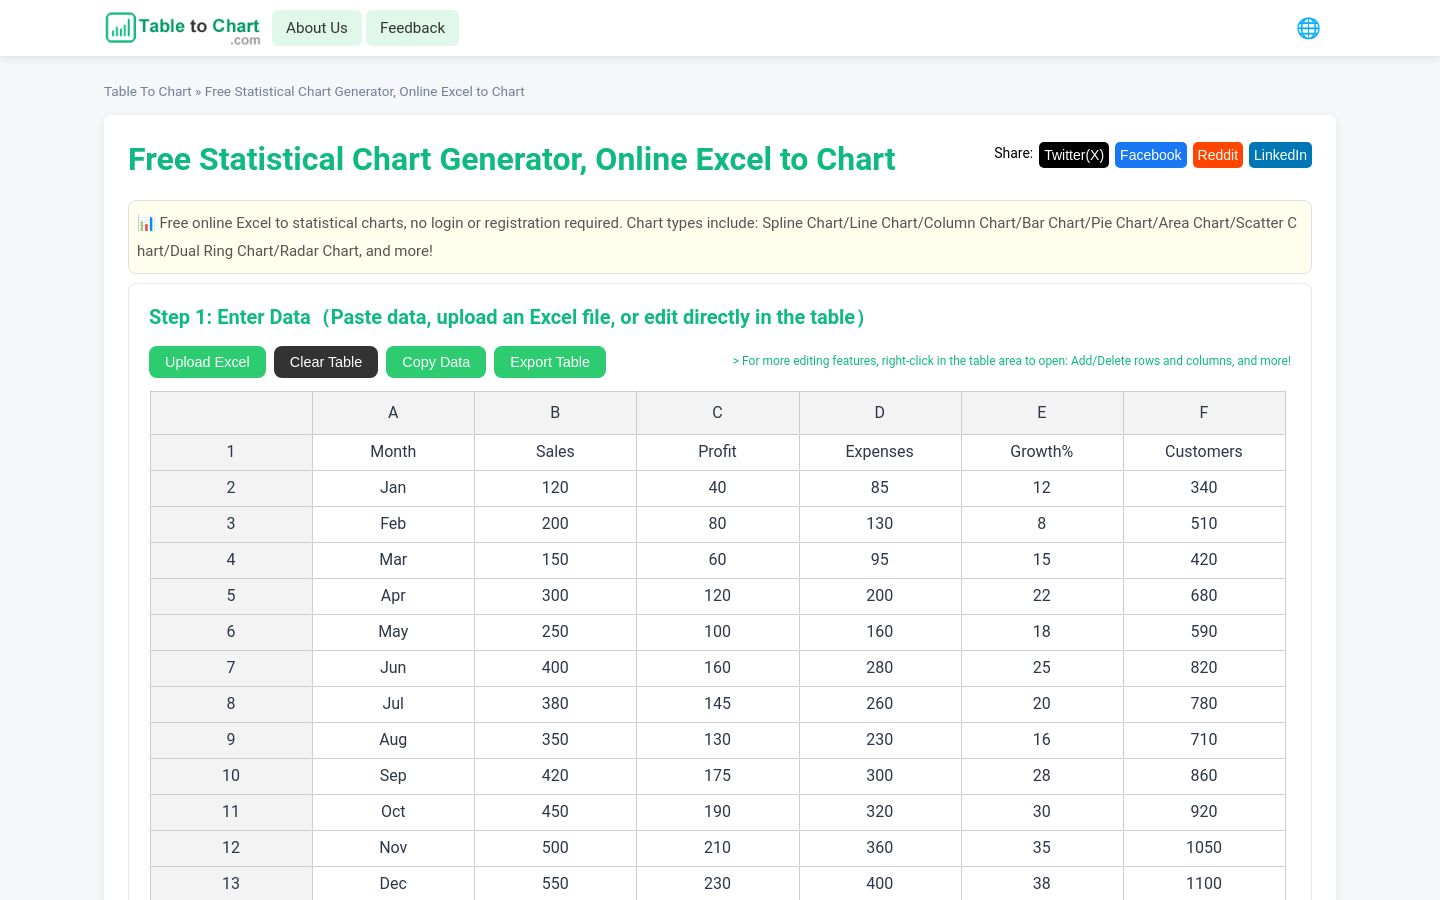
Table To Chart is a web-based statistical chart generator designed to turn tabular data into visual charts directly in the browser. Users can enter data by modifying table cells, uploading Excel files (.xlsx or .xls), or pasting directly from spreadsheet applications. The platform supports multiple visualization formats including line, spline, column, bar, pie, area, scatter, dual ring, radar, heatmap, and funnel charts. Processing occurs locally within the browser without uploading data to external servers, and generated charts can be downloaded free of watermarks.
- Availability:
- launched
- Access:
- free
- Format:
- software
- Platform:
- web
Pricing at launch: Table To Chart is completely free to use with unrestricted, watermark-free chart downloads.
Core capabilities
Data Input & Table Editing
Allows data entry by pasting spreadsheet text, uploading Excel files (.xlsx and .xls), or directly modifying table cells, rows, columns, and column sorting.
Statistical Chart Generation
Keep discovering
Related debuts
Continue with products that solve a similar problem or serve the same kind of maker.